Harnessing the Power of Visual Statistics: Unveiling the Impact of Event Marketing

This article explores the vital role of visual statistics in event marketing. Event marketing, a dynamic and versatile strategy, has unique challenges when it comes to measuring its success. Visual statistics, or data visualization, offer a solution by making complex event data accessible and understandable.
This article covers the types of visual statistics applicable to event marketing, including attendee demographics, engagement metrics, social media activity, and post-event surveys.
It also highlights key event marketing statistics like registration and attendance, ROI, lead generation, audience engagement, and brand exposure. Real-world case studies illustrate practical applications, and best practices are provided for leveraging visual statistics effectively.
Introduction
In an era dominated by digital technology and data-driven decision-making, event marketing continues to stand as a resilient and impactful strategy for businesses and organizations. Whether it’s a product launch, trade show, or corporate seminar, events provide an invaluable platform for engagement, networking, and brand exposure.
Yet, to measure the effectiveness of event marketing and refine strategies, data-driven insights are indispensable. This is where visual statistics come into play, enabling businesses to make sense of the complex data generated by events and make informed decisions.
In this article, we’ll explore the world of visual statistics in the context of event marketing statistics, shedding light on how it can provide actionable insights to enhance your marketing efforts.
The Power of Event Marketing
Event Marketing: A Dynamic and Versatile Strategy
Event marketing is a multifaceted strategy that encompasses a wide range of activities, from conferences and exhibitions to product launches and promotional events. What makes it a standout strategy is its ability to deliver a unique and personalized experience to an audience, enabling businesses to forge deep connections and build brand loyalty.
In an age where consumers are bombarded with digital advertising, the in-person experience remains unparalleled.
The Challenges of Measuring Event Marketing Success
Despite its many benefits, event marketing comes with its share of challenges, particularly when it comes to measuring its success. Unlike digital marketing, where clicks, conversions, and engagement can be tracked with relative ease, quantifying the impact of an event is more complex.
Event marketing statistics are essential, but they are often elusive due to the dynamic and multifaceted nature of events. Attendee engagement, brand exposure, lead generation, and post-event effects all contribute to the success of an event, making it a challenging task to evaluate and optimize event marketing efforts.
The Role of Visual Statistics
Visual Statistics: A Data-Driven Approach
Visual statistics, also known as data visualization, is an invaluable tool in the world of data analysis. It involves presenting data in a graphical format, such as charts, graphs, and infographics, to make complex information more accessible and understandable.
Visual statistics can be applied to a wide range of data types, including event marketing data, to provide a comprehensive and clear overview of various performance indicators.
The Appeal of Visual Statistics in Event Marketing
Event marketing generates an abundance of data, including attendee demographics, engagement metrics, social media activity, and post-event surveys. While this data is vital, it is often difficult to make sense of it in raw form.
Visual statistics bridge this gap by transforming data into visually engaging and insightful representations.
Here’s why visual statistics are particularly appealing in event marketing:
- Accessibility: Visualizations make data accessible to a broad audience, allowing non-technical stakeholders to grasp key insights quickly.
- Clarity: Complex data can be distilled into easy-to-understand visualizations, making it simpler to identify trends, anomalies, and opportunities.
- Engagement: Visual statistics are inherently engaging and can captivate the audience’s attention, much like a well-executed event.
- Decision Support: Visualizations help event marketers make data-driven decisions, optimizing strategies for future events.
Types of Visual Statistics for Event Marketing
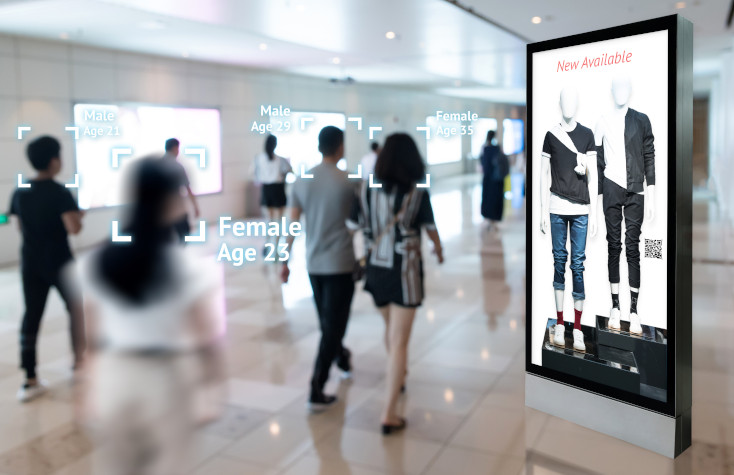
Attendee Demographics
Understanding your event’s audience is crucial for tailoring marketing efforts and content. Visual statistics can help you create demographic profiles of attendees, showcasing factors such as age, gender, location, and profession.
This data can be presented using bar charts, pie charts, and heatmaps, offering a clear picture of who attended your event.
Engagement Metrics
Tracking attendee engagement during an event is essential for gauging its success. Visual statistics can present engagement metrics in real-time dashboards or post-event reports.
Metrics like session attendance, interaction with exhibitors, and participation in workshops can be displayed through line graphs, scatter plots, and stacked bar charts, providing insights into which elements of your event resonated most with attendees.
Social Media Activity
In today’s digital age, social media plays a significant role in event marketing. Visual statistics can aggregate data from various social platforms, presenting metrics like hashtag mentions, shares, and comments in a visually compelling manner.
Word clouds, network graphs, and time series charts are great tools for representing social media activity.
Post-Event Surveys
Gathering feedback from attendees is essential for continuous improvement. Visual statistics can help summarize survey results through thematic maps, Likert scale visualizations, and sentiment analysis.
This allows you to quickly identify areas of strength and areas that need improvement.
Key Event Marketing Statistics
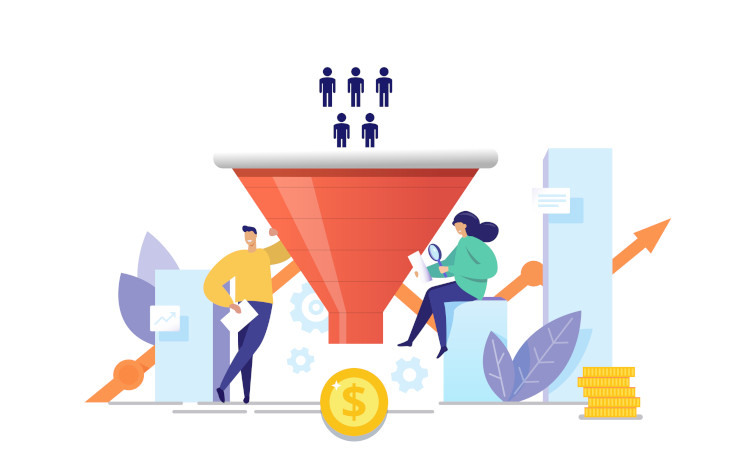
Registration and Attendance
Visual statistics can provide insights into the number of registrations compared to actual attendance. A registration funnel visualization, for instance, can show where drop-offs occurred in the registration process, helping you refine your approach.
Return on Investment (ROI)
Calculating the ROI of an event is critical for justifying the resources spent. Visual statistics can depict the costs incurred versus the value generated, considering factors like leads generated, sales closed, and brand exposure.
A visually appealing ROI dashboard can offer a comprehensive view of your event’s financial performance.
Lead Generation
Visual statistics can reveal the number and quality of leads generated at an event.
Using scatter plots or lead generation heatmaps, you can analyze the distribution of leads across different exhibitors or sessions, allowing you to optimize lead generation strategies for future events.
Audience Engagement
Visualizing audience engagement is vital for understanding which sessions or activities resonated with attendees.
Heatmaps of audience movements, session popularity graphs, and social media sentiment word clouds can help uncover patterns and preferences.
Brand Exposure
Events are an excellent platform for brand exposure, and visual statistics can showcase the reach and impact of your event’s branding efforts. Metrics like media impressions, social media reach, and press coverage can be presented through interactive dashboards and infographics.
Case Studies: Real-World Examples
To illustrate the practical application of visual statistics in event marketing, let’s delve into a few case studies:
Case Study 1: Tech Conference
A tech conference used visual statistics to analyze attendee demographics and preferences. By creating interactive dashboards, they discovered that a substantial portion of their audience were mid-level professionals interested in AI and machine learning.
This insight led to tailored marketing for the next event, resulting in a 20% increase in attendance.
Case Study 2: Trade Show
A trade show leveraged visual statistics to map attendee movements throughout the event. Heatmaps revealed that certain booths and areas attracted significantly more foot traffic.
Armed with this data, the organizers adjusted the layout for the following year, increasing exhibitor satisfaction and revenue.
Case Study 3: Product Launch
A product launch event utilized visual statistics to track social media activity. They discovered that a particular hashtag was trending, generating a buzz around the event.
Capitalizing on this, they encouraged attendees to use the hashtag, resulting in increased online visibility and engagement.
Best Practices for Visual Statistics in Event Marketing
Start with Clear Objectives
Before diving into data analysis and visualization, define your objectives. What are you looking to achieve with your event, and what specific insights do you need?
This will guide your data collection and analysis process.
Collect Data Strategically
Collect data that aligns with your objectives. This may include attendee registration data, engagement metrics, social media mentions, and post-event surveys.
Make use of event management software and tools to streamline data collection.
Choose the Right Visualization Tools
Select visualization tools that best suit your data and objectives. Tools like Tableau, Power BI, and Google Data Studio offer a wide range of options for creating impactful visualizations.
Tell a Compelling Story
Use your visual statistics to tell a compelling story about your event. Create reports and dashboards that flow logically, highlighting key findings and actionable insights.
Keep It Interactive
Interactive dashboards and reports enable stakeholders to explore data on their terms. This fosters engagement and empowers users to draw their conclusions.
Continuously Improve
Use the insights gained from visual statistics to refine your event marketing strategies. Each event is an opportunity to learn and enhance your approach.
The Future of Visual Statistics in Event Marketing
The world of event marketing is constantly evolving, and so is the role of visual statistics in this field. As technology advances, we can expect even more powerful tools and techniques for data analysis and visualization.
Here are some trends to watch for in the future:
Predictive Analytics
Visual statistics will increasingly incorporate predictive analytics, enabling event marketers to forecast attendee behavior, optimize event design, and make data-driven decisions in real-time.
Augmented and Virtual Reality
With the integration of augmented and virtual reality, visual statistics will evolve to provide immersive data experiences, allowing event organizers to gain deeper insights into attendee interactions and preferences.
AI-Powered Insights
Artificial intelligence will play a more significant role in event marketing, providing automated insights and recommendations based on visual statistics, helping organizers fine-tune their strategies.
Conclusion
Event marketing remains a powerful and irreplaceable tool in a marketer’s arsenal, offering unique opportunities for engagement and brand exposure. Yet, to harness its full potential, businesses and organizations need to leverage the power of visual statistics.
Visual statistics enable event marketers to transform complex data into actionable insights, making it easier to measure the success of their events and optimize future strategies.
By following best practices, staying on top of industry trends, and continuously improving, event marketers can unlock the full potential of their events and ensure their marketing efforts have a lasting impact.
In a data-driven world, the ability to analyze and visualize event marketing statistics is a competitive advantage that no organization can afford to ignore. As technology continues to advance, the future of event marketing, coupled with visual statistics, promises even more exciting opportunities and outcomes.
So, embrace the power of visual statistics in event marketing and propel your organization to new heights of success.